This repository has the code and figures for my bachelor's project: Bell State Fidelity under Hardware Noise: Custom Model vs IBM FakeVigoV2. I compared two noise models to see which one hurts the Bell state more, and I used Bell Measurement Fidelity (BMF) to measure the damage.
Author: Umayr Utmaan — Bachelor of Physics, Nangarhar University
Does a hand-built noise model or real IBM device calibration data cause more damage to Bell-state fidelity in simulation?
I built the Bell state |Φ+⟩ = (|00⟩ + |11⟩) / √2 and ran it through two noise models using Qiskit Aer:
- Custom model — I built this myself using T1 = 30 µs, T2 = 50 µs, gate errors on H (8.1%) and CX (15.1%), and readout errors. I based the numbers on typical IBM superconducting qubit specs.
- FakeVigoV2 model — this one pulls real calibration data from IBM's FakeVigo backend using
NoiseModel.from_backend(). It uses actual gate error rates and relaxation times from the device.
I ran each model 10 times with 10,000 shots per run. BMF just counts how often you get |00⟩ or |11⟩ — it's not true fidelity (you'd need quantum state tomography for that), but it's a good enough proxy for this project.
| Model | Mean BMF | Std Dev | Mean Error Rate |
|---|---|---|---|
| Custom (hand-built) | ~0.8040 | ±0.0034 | ~0.1960 |
| FakeVigoV2 (IBM) | ~0.9018 | ±0.0030 | ~0.0982 |
| Difference (Custom − FakeVigo) | −0.0977 | — | — |
The FakeVigo model does better because IBM's real calibration numbers are lower than the conservative estimates I used in my custom model.
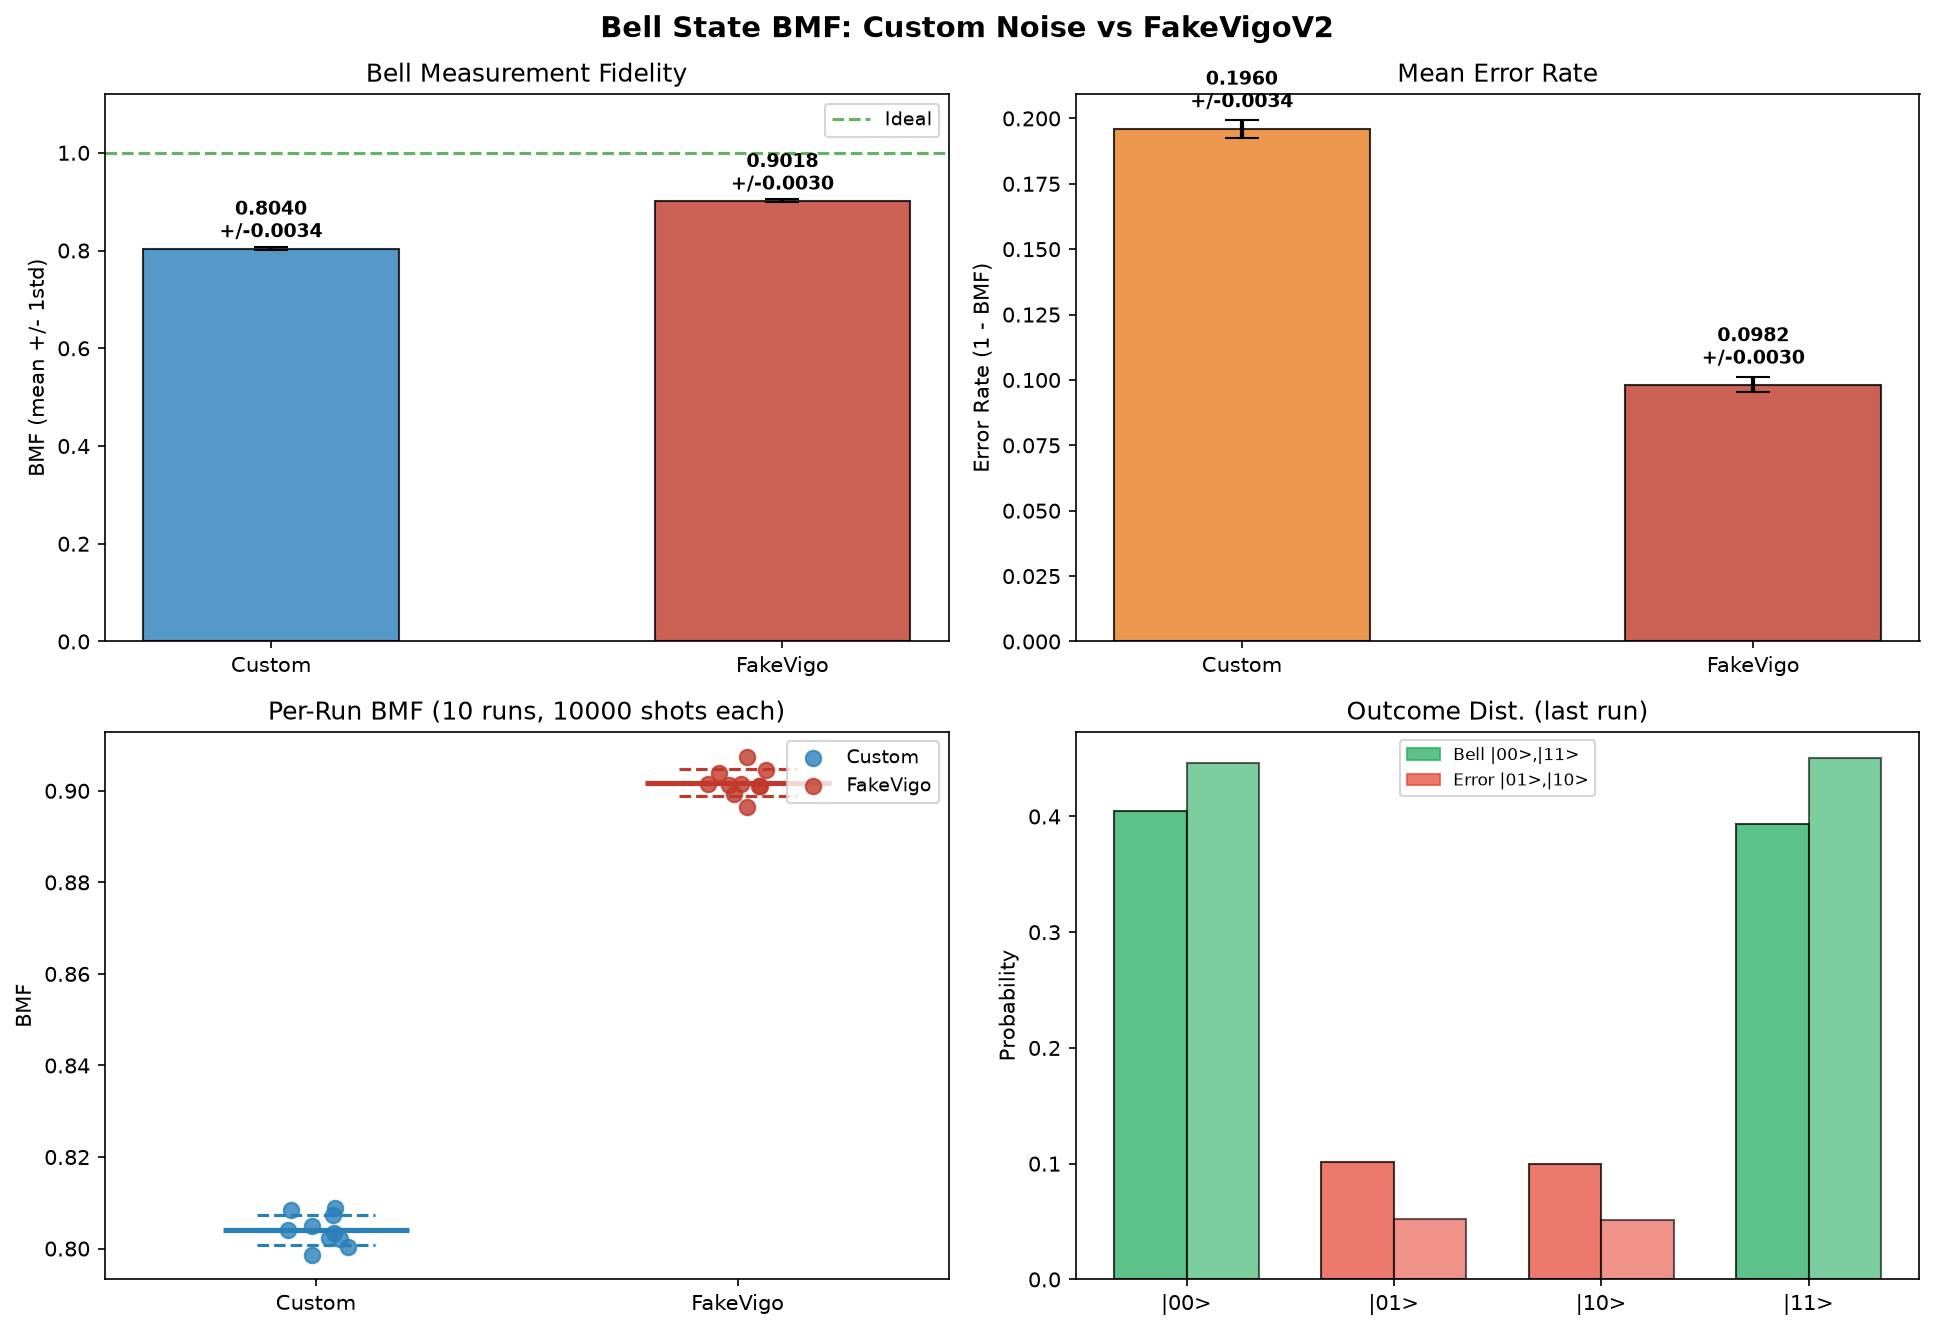
The figure has 4 panels:
- Mean BMF ± 1σ — bar chart for both models, with ideal BMF = 1.0 as reference
- Mean Error Rate — bar chart showing 1 − BMF for each model
- Per-run scatter — all 10 individual BMF values with mean and ±1σ lines
- Outcome distribution — probability of each result from the last run
.
├── README.md
├── requirements.txt
├── LICENSE
├── bell_state_analysis.py
└── figures/
    └── Bell_state_bmf_analysis.png